London, UK
Global Financial Center & Urban Regeneration
Key Facts Quick Reference
Population
~9 Million
Area
1,572 km²
GDP
~22% of UK Total
Major Landmarks
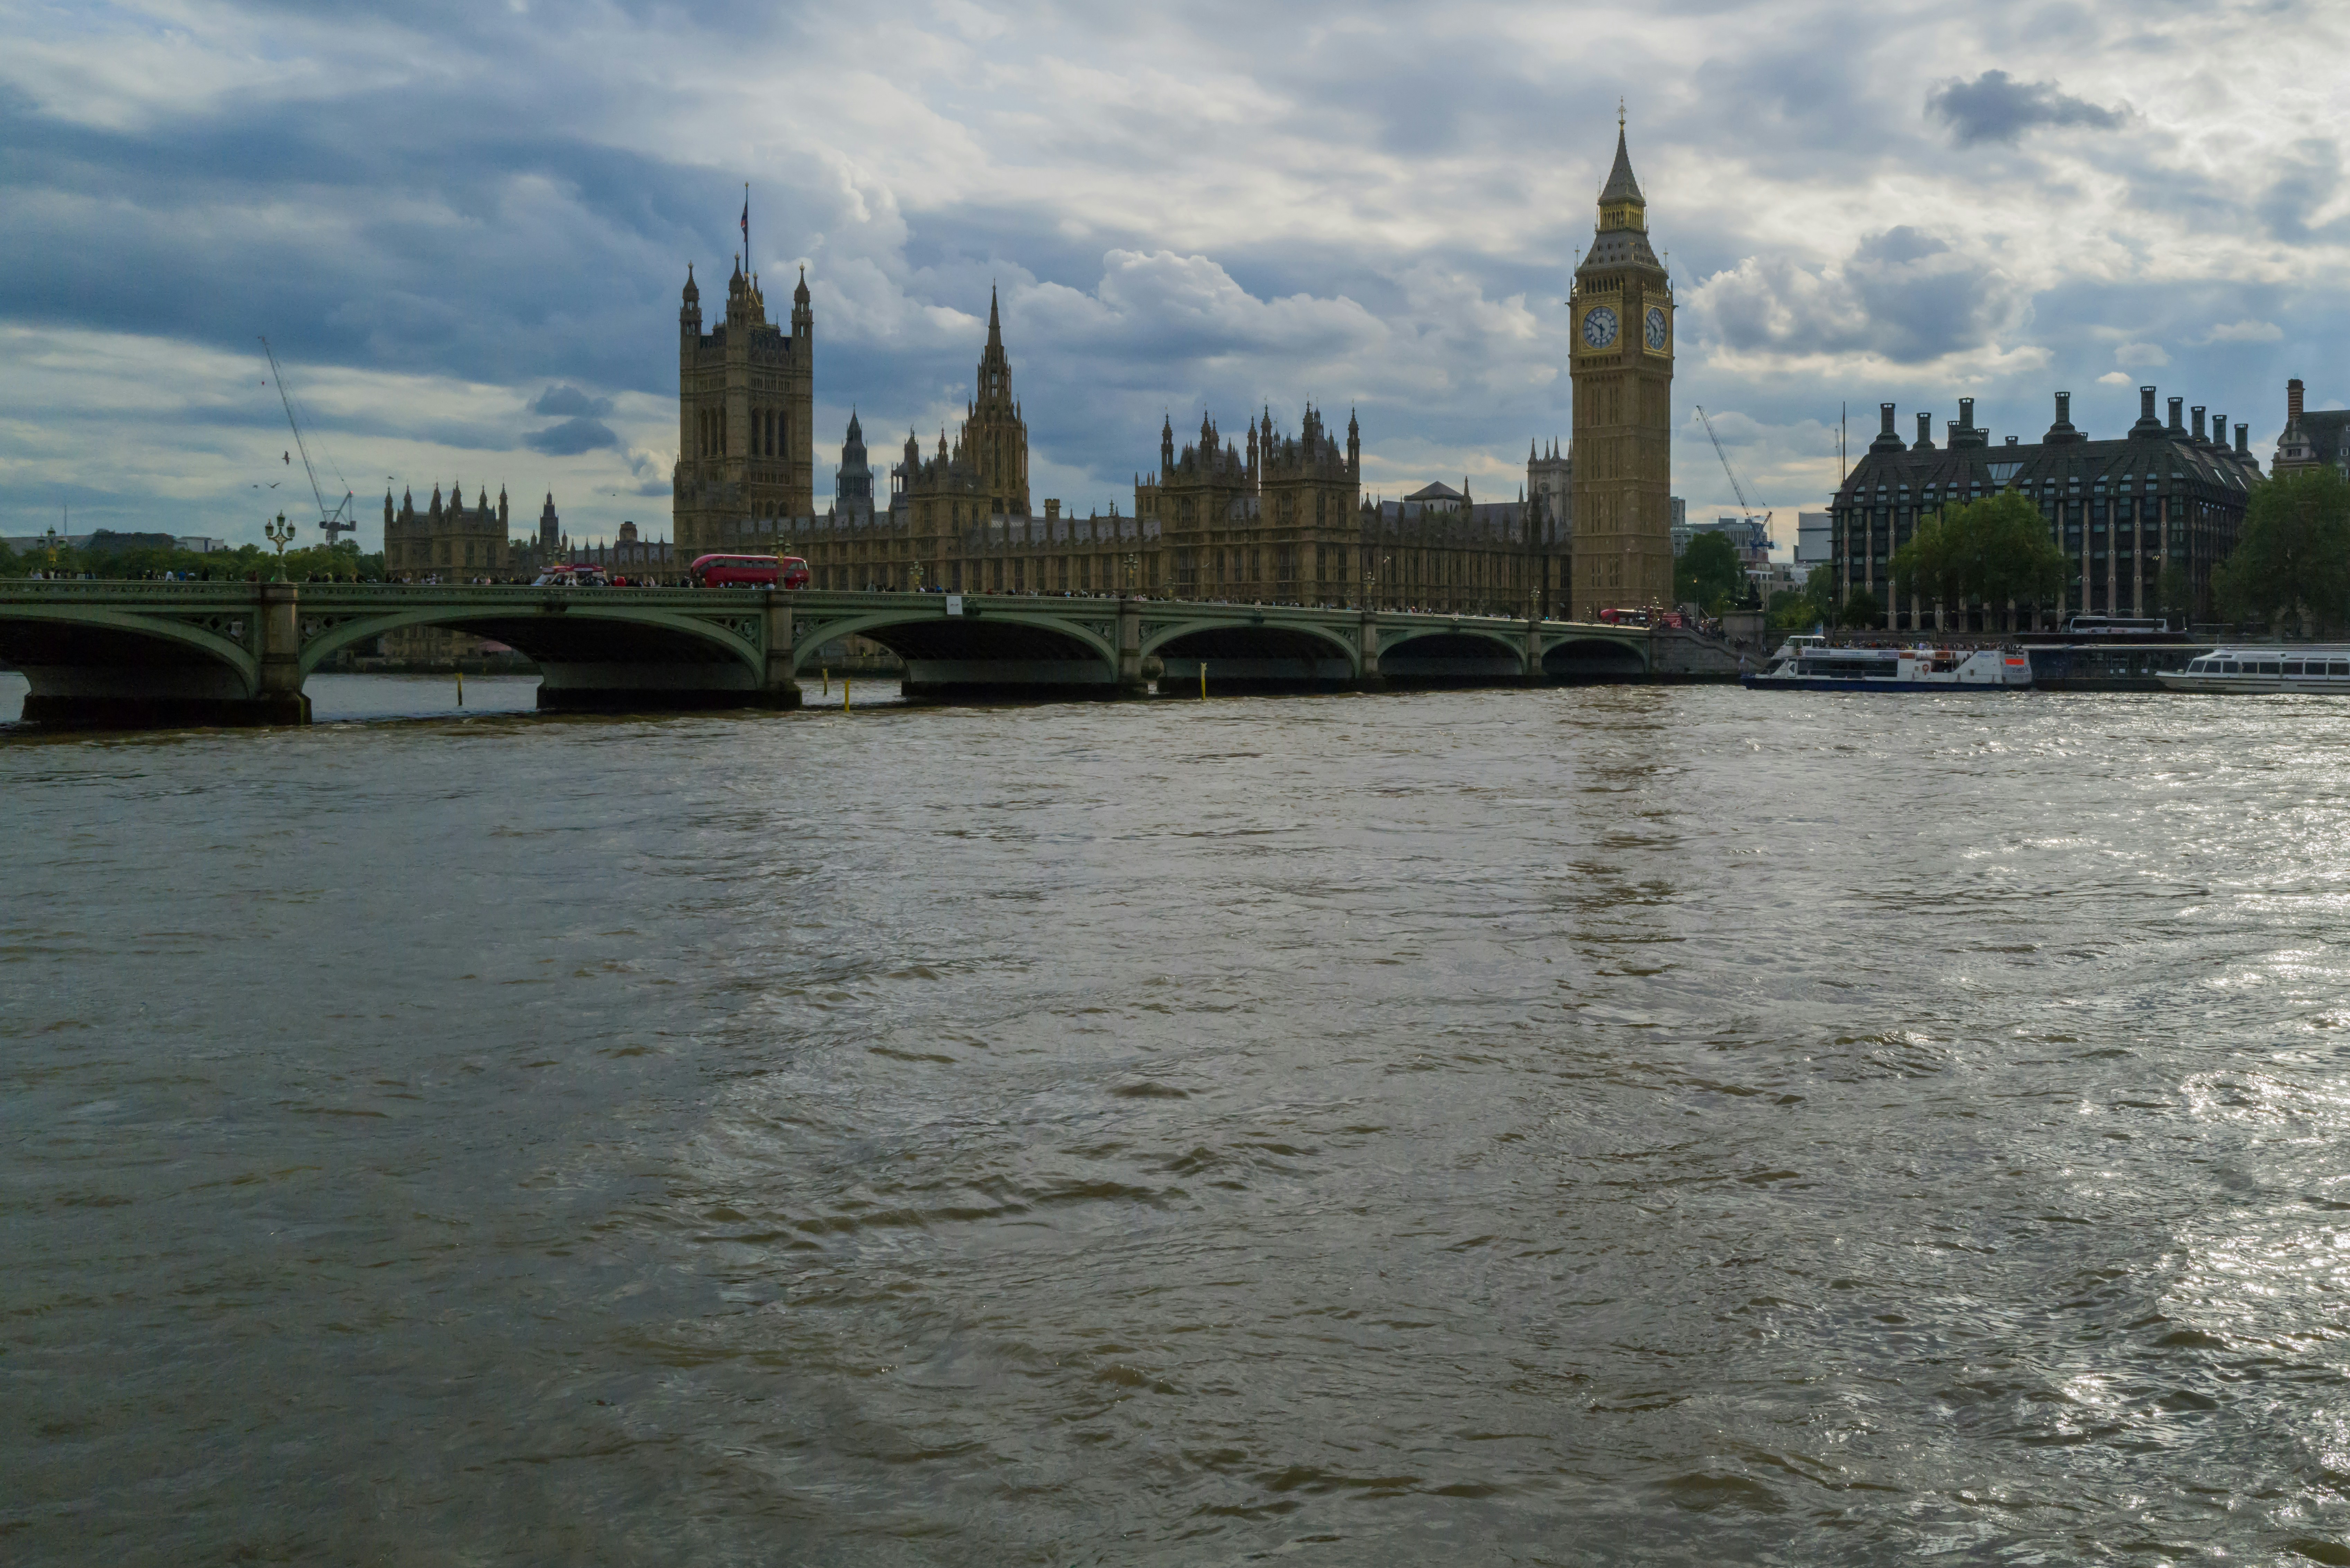
Big Ben, Tower Bridge
Transport
270 Tube Stations
Overview
Located in South East England at 51.5°N, 0°W, London is the capital and largest city of the United Kingdom. Covering 1,572 km², it is a leading global city with immense influence in arts, commerce, education, entertainment, fashion, finance, and media.
Human Geography
Population & Structure
Home to ~9 million people in the city and ~14 million in the wider metropolitan area. The urban structure radiates from Central London out to inner and outer suburban zones.
Economic Importance
A global financial center rivaling New York. Key sectors include finance (City of London, Canary Wharf), technology, media, and tourism.
Fieldwork Methodology & Data Collection
1. Environmental Quality Surveys (EQS)
Method: Bipolar scoring system (-3 to +3) assessing factors like noise, litter, building condition, and greenery across different transects (e.g., from Canary Wharf to Poplar).
Purpose: To quantify the impact of urban regeneration on the local environment.
2. Pedestrian and Traffic Counts
Method: 5-minute systematic counts at 10 different sites at three times during the day.
Purpose: To measure footfall and congestion, indicating the functional zones of the city (CBD vs. residential).
3. Land Use Mapping (RICE)
Method: Ground-truthing using GOAD maps to categorize ground-floor and upper-floor land use (Residential, Industrial, Commercial, Entertainment).
Purpose: To identify spatial patterns and the extent of gentrification.
Analysis, Findings & Conclusions
Data collected from the Docklands and surrounding areas revealed stark contrasts in urban development.
- Environmental Quality: Regenerated areas (Canary Wharf) scored an average of +12 on the EQS, while adjacent unregenerated areas scored -2, highlighting significant spatial inequality.
- Land Use Shift: Mapping showed a 90% transition from industrial/warehouse use to high-end commercial and luxury residential over the last 30 years.
- Conclusion: While regeneration has successfully created a secondary CBD and improved infrastructure (DLR), it has led to social polarization and gentrification, displacing traditional working-class communities.
Maps and Visuals
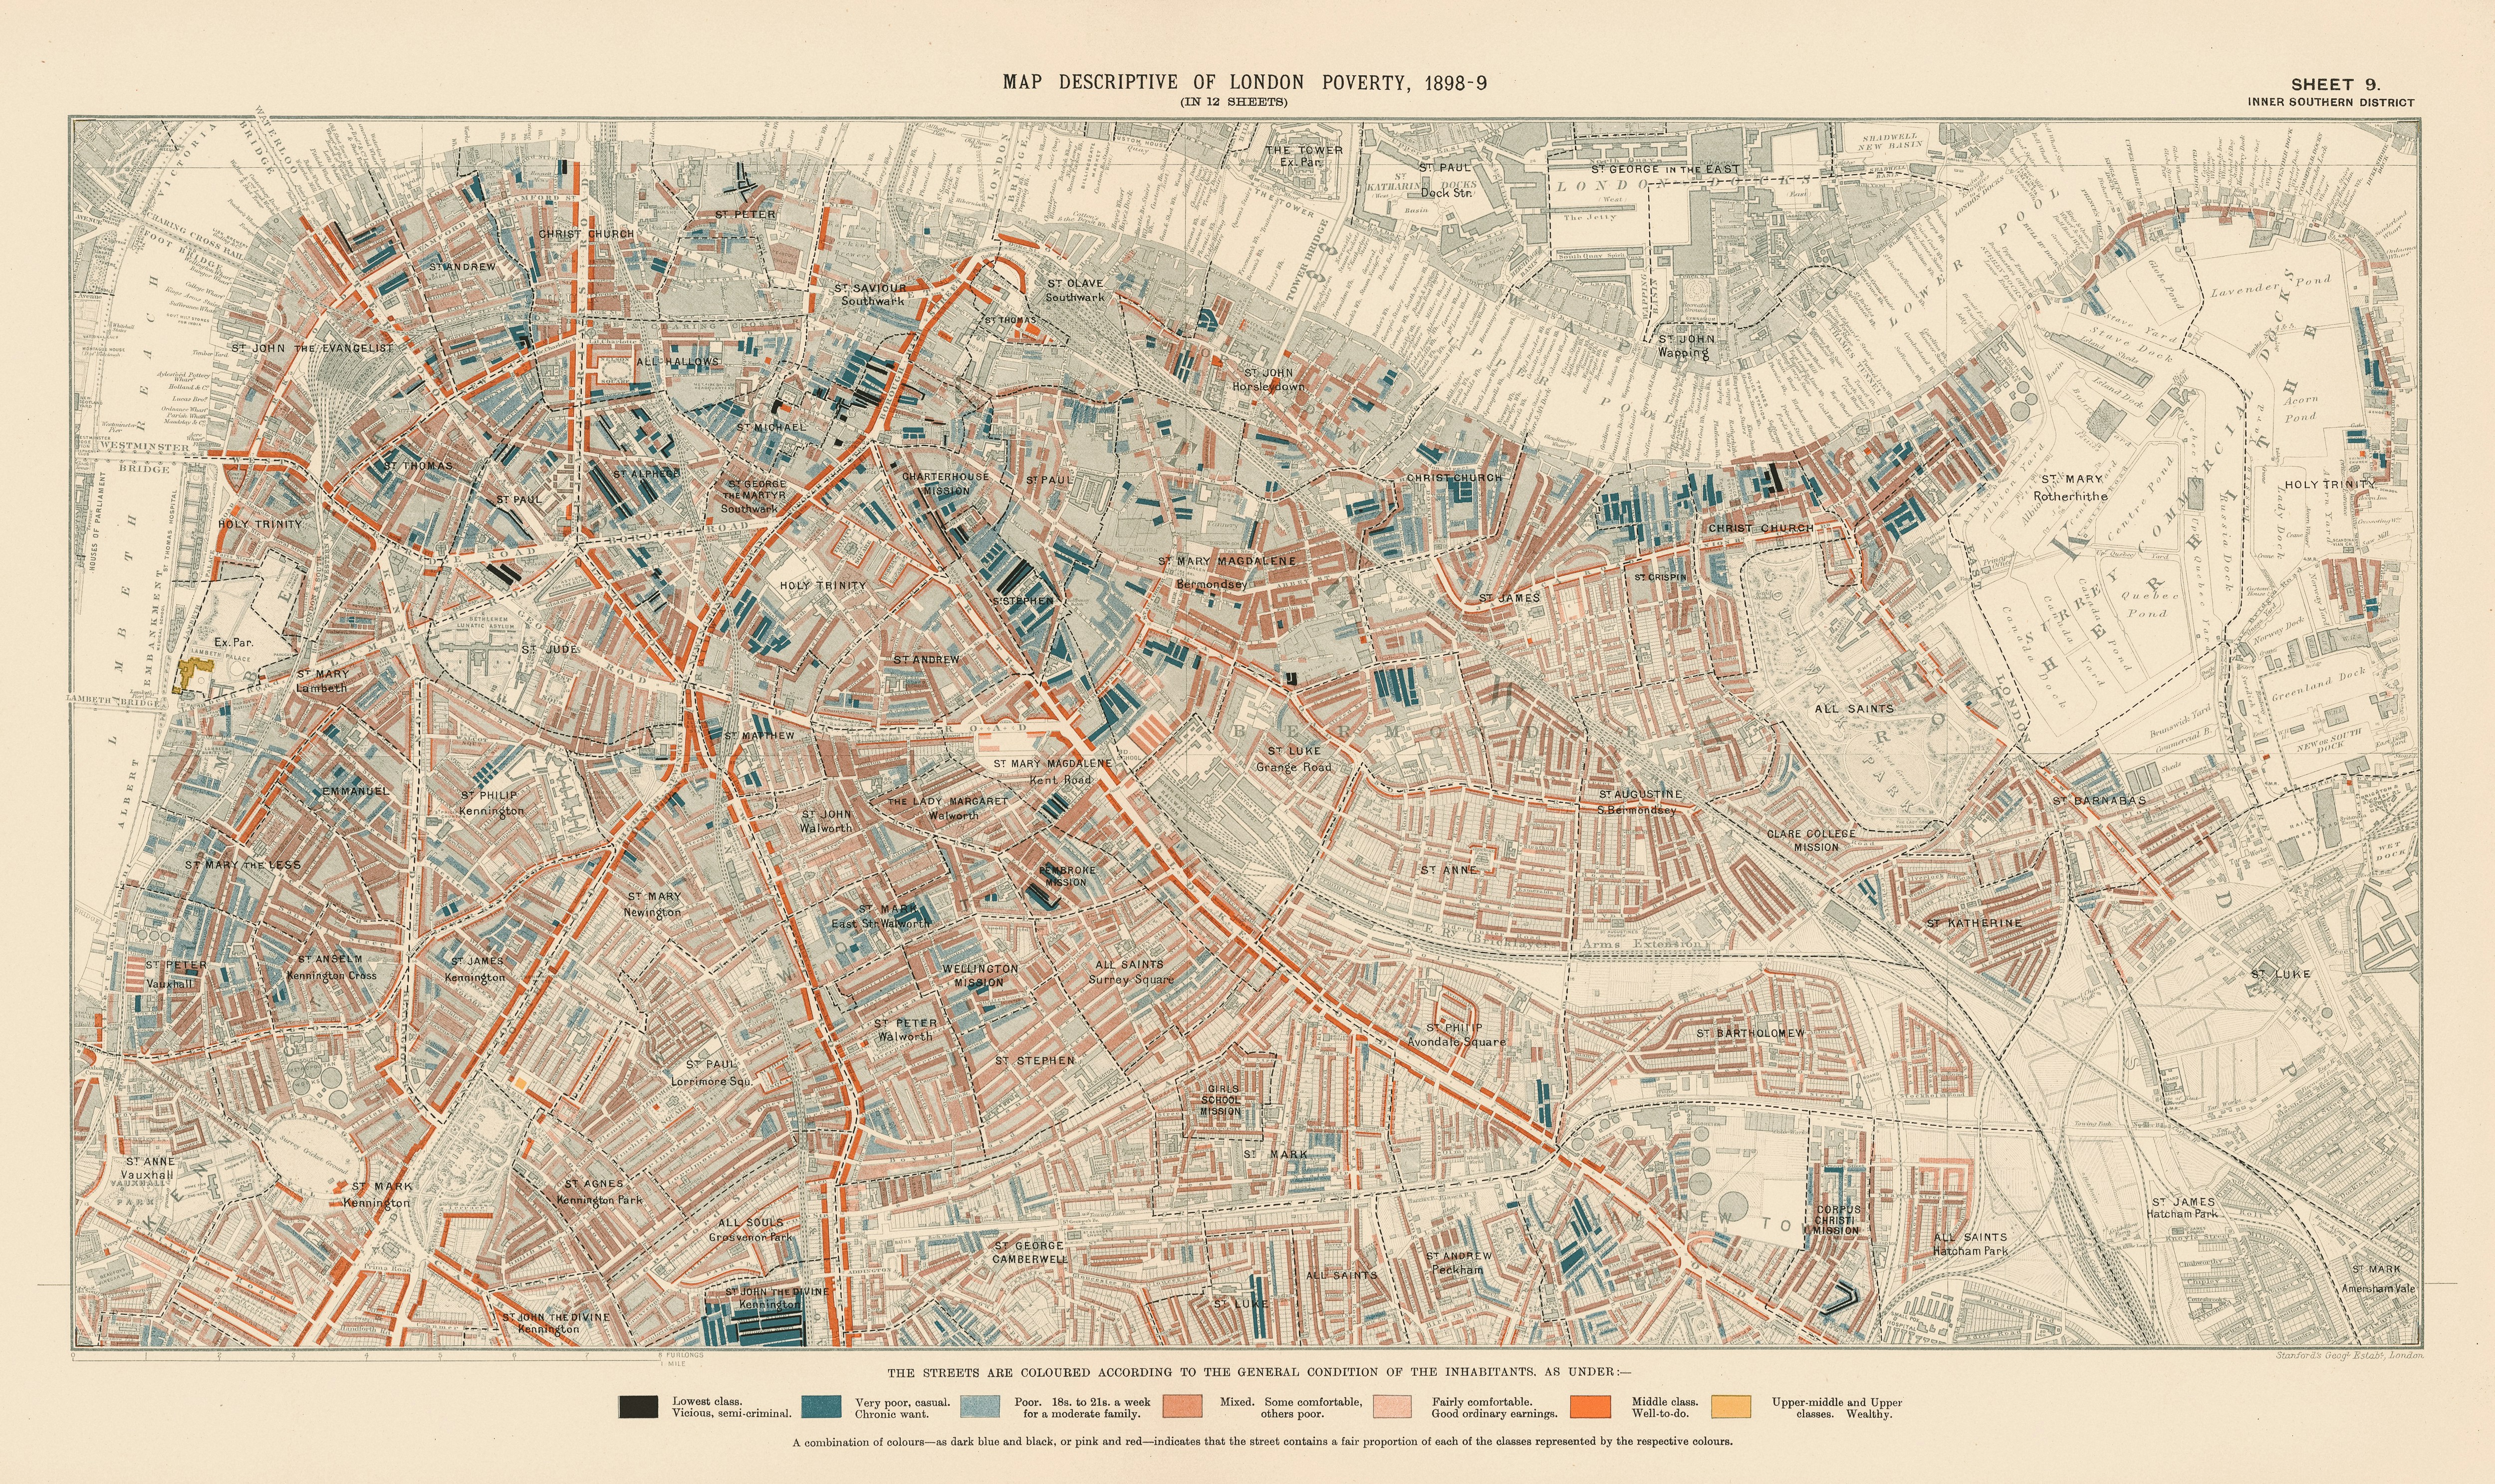
London Urban Zones and Districts
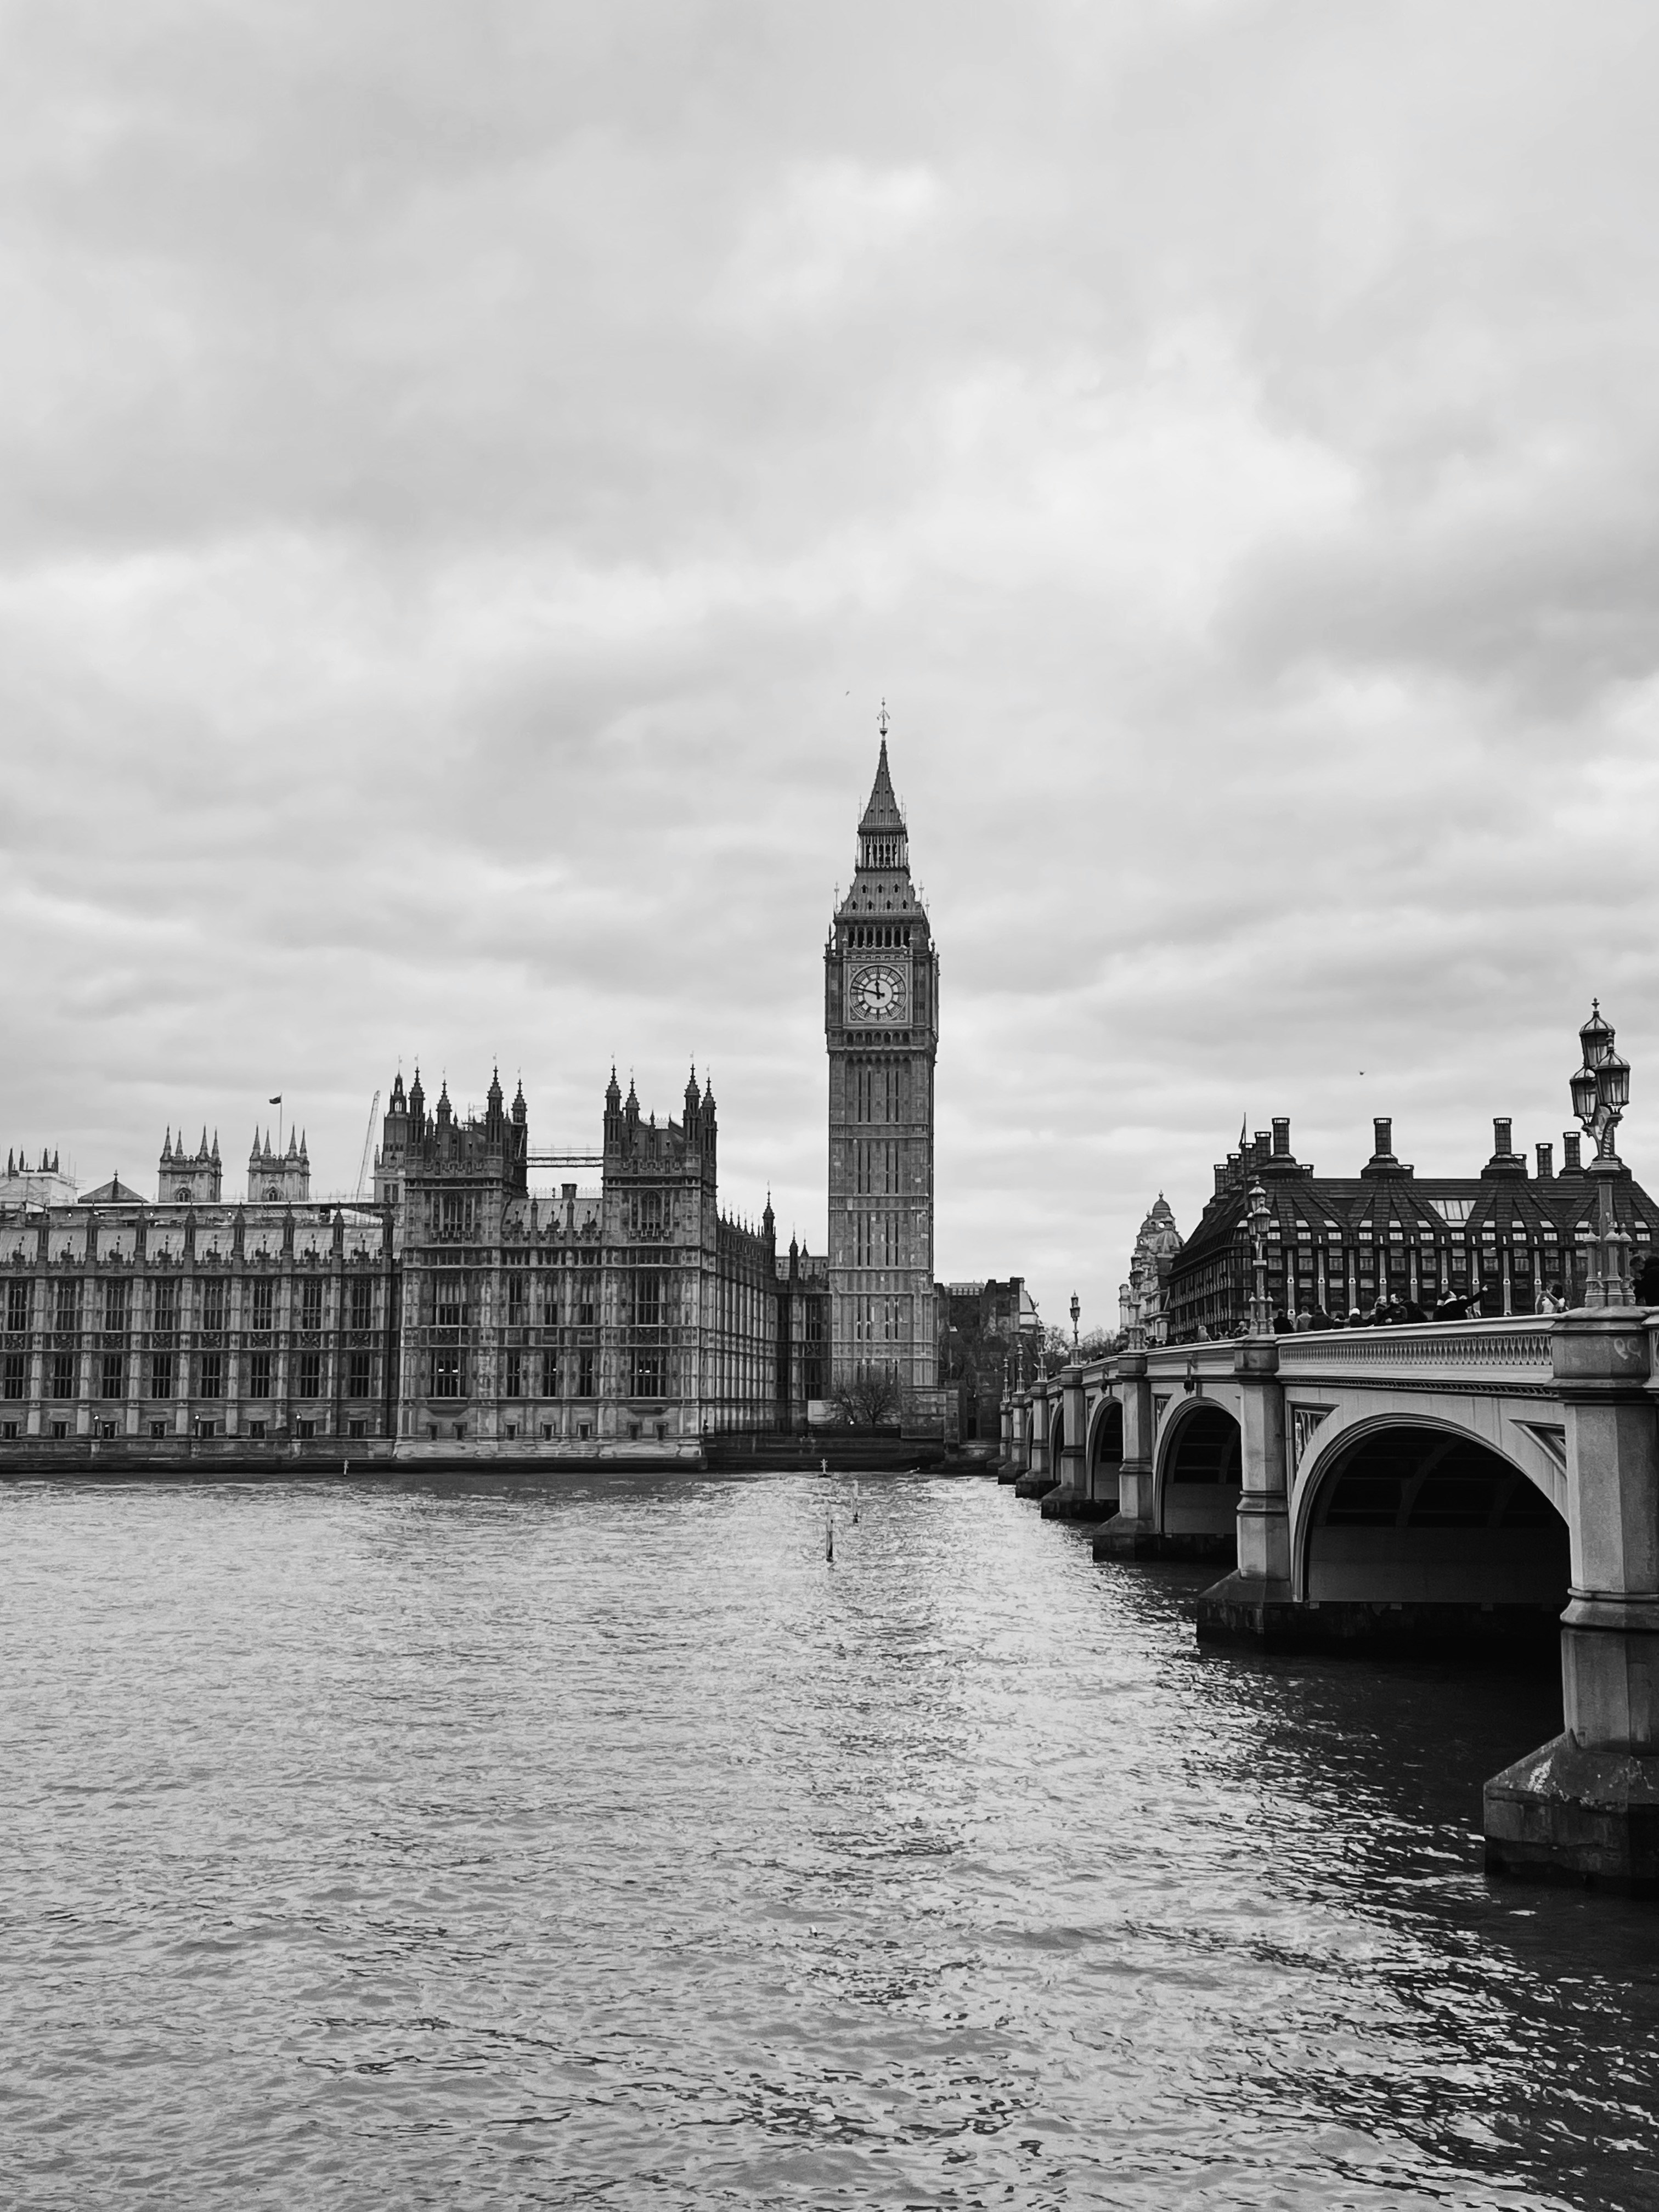
Iconic London landmarks including the River Thames and modern architecture