
Data & Graphs Lab
Master Data Analysis, Interpretation & Visualization
Transform raw data into meaningful insights. Learn to read, interpret, create, and analyze graphs and charts using real UK and global data. Essential skills for GCSE Geography and beyond.
Why Data Skills Matter
Data analysis is essential in modern geography. From understanding population trends to analyzing climate patterns, graphs and statistics help us make sense of complex geographical phenomena. Master these skills to excel in exams and understand the world around you.
What is Data & Graphs?
Data analysis and visualization are fundamental skills in geography, helping us understand patterns, trends, and relationships in geographical data.
Why Learn Data & Graphs?
Exam Essentials
Data analysis questions appear in every GCSE Geography exam. Master graph interpretation, calculation, and creation to maximize your marks.
Real-World Understanding
Understand population trends, climate change, economic development, and environmental issues through data visualization.
Data Literacy
Develop critical thinking skills to evaluate data sources, identify bias, and make evidence-based decisions.
Career Relevance
Essential for careers in data science, research, policy-making, journalism, and business analytics.
What You'll Learn
- 1Read and interpret bar charts, line graphs, and pie charts
- 2Analyze climate graphs and scatter graphs
- 3Calculate mean, median, mode, and range
- 4Identify trends, patterns, and anomalies
- 5Create accurate graphs from data tables
- 6Understand correlation and relationships
- 7Apply statistical concepts to real UK data
- 8Answer exam-style data questions confidently
How to Use This Hub
Choose Your Level
Select KS2, KS3, or GCSE to match your current study level
Learn Graph Types
Study each graph type with interactive examples and explanations
Use Interactive Tools
Create graphs, analyze data, and calculate statistics with real-time feedback
Practice Questions
Test your skills with exam-style questions and instant feedback
Time Estimate: 10-20 minutes per session depending on your level
Graph Types Explained
Master each graph type with detailed explanations, examples, and reading tips.
Bar Charts
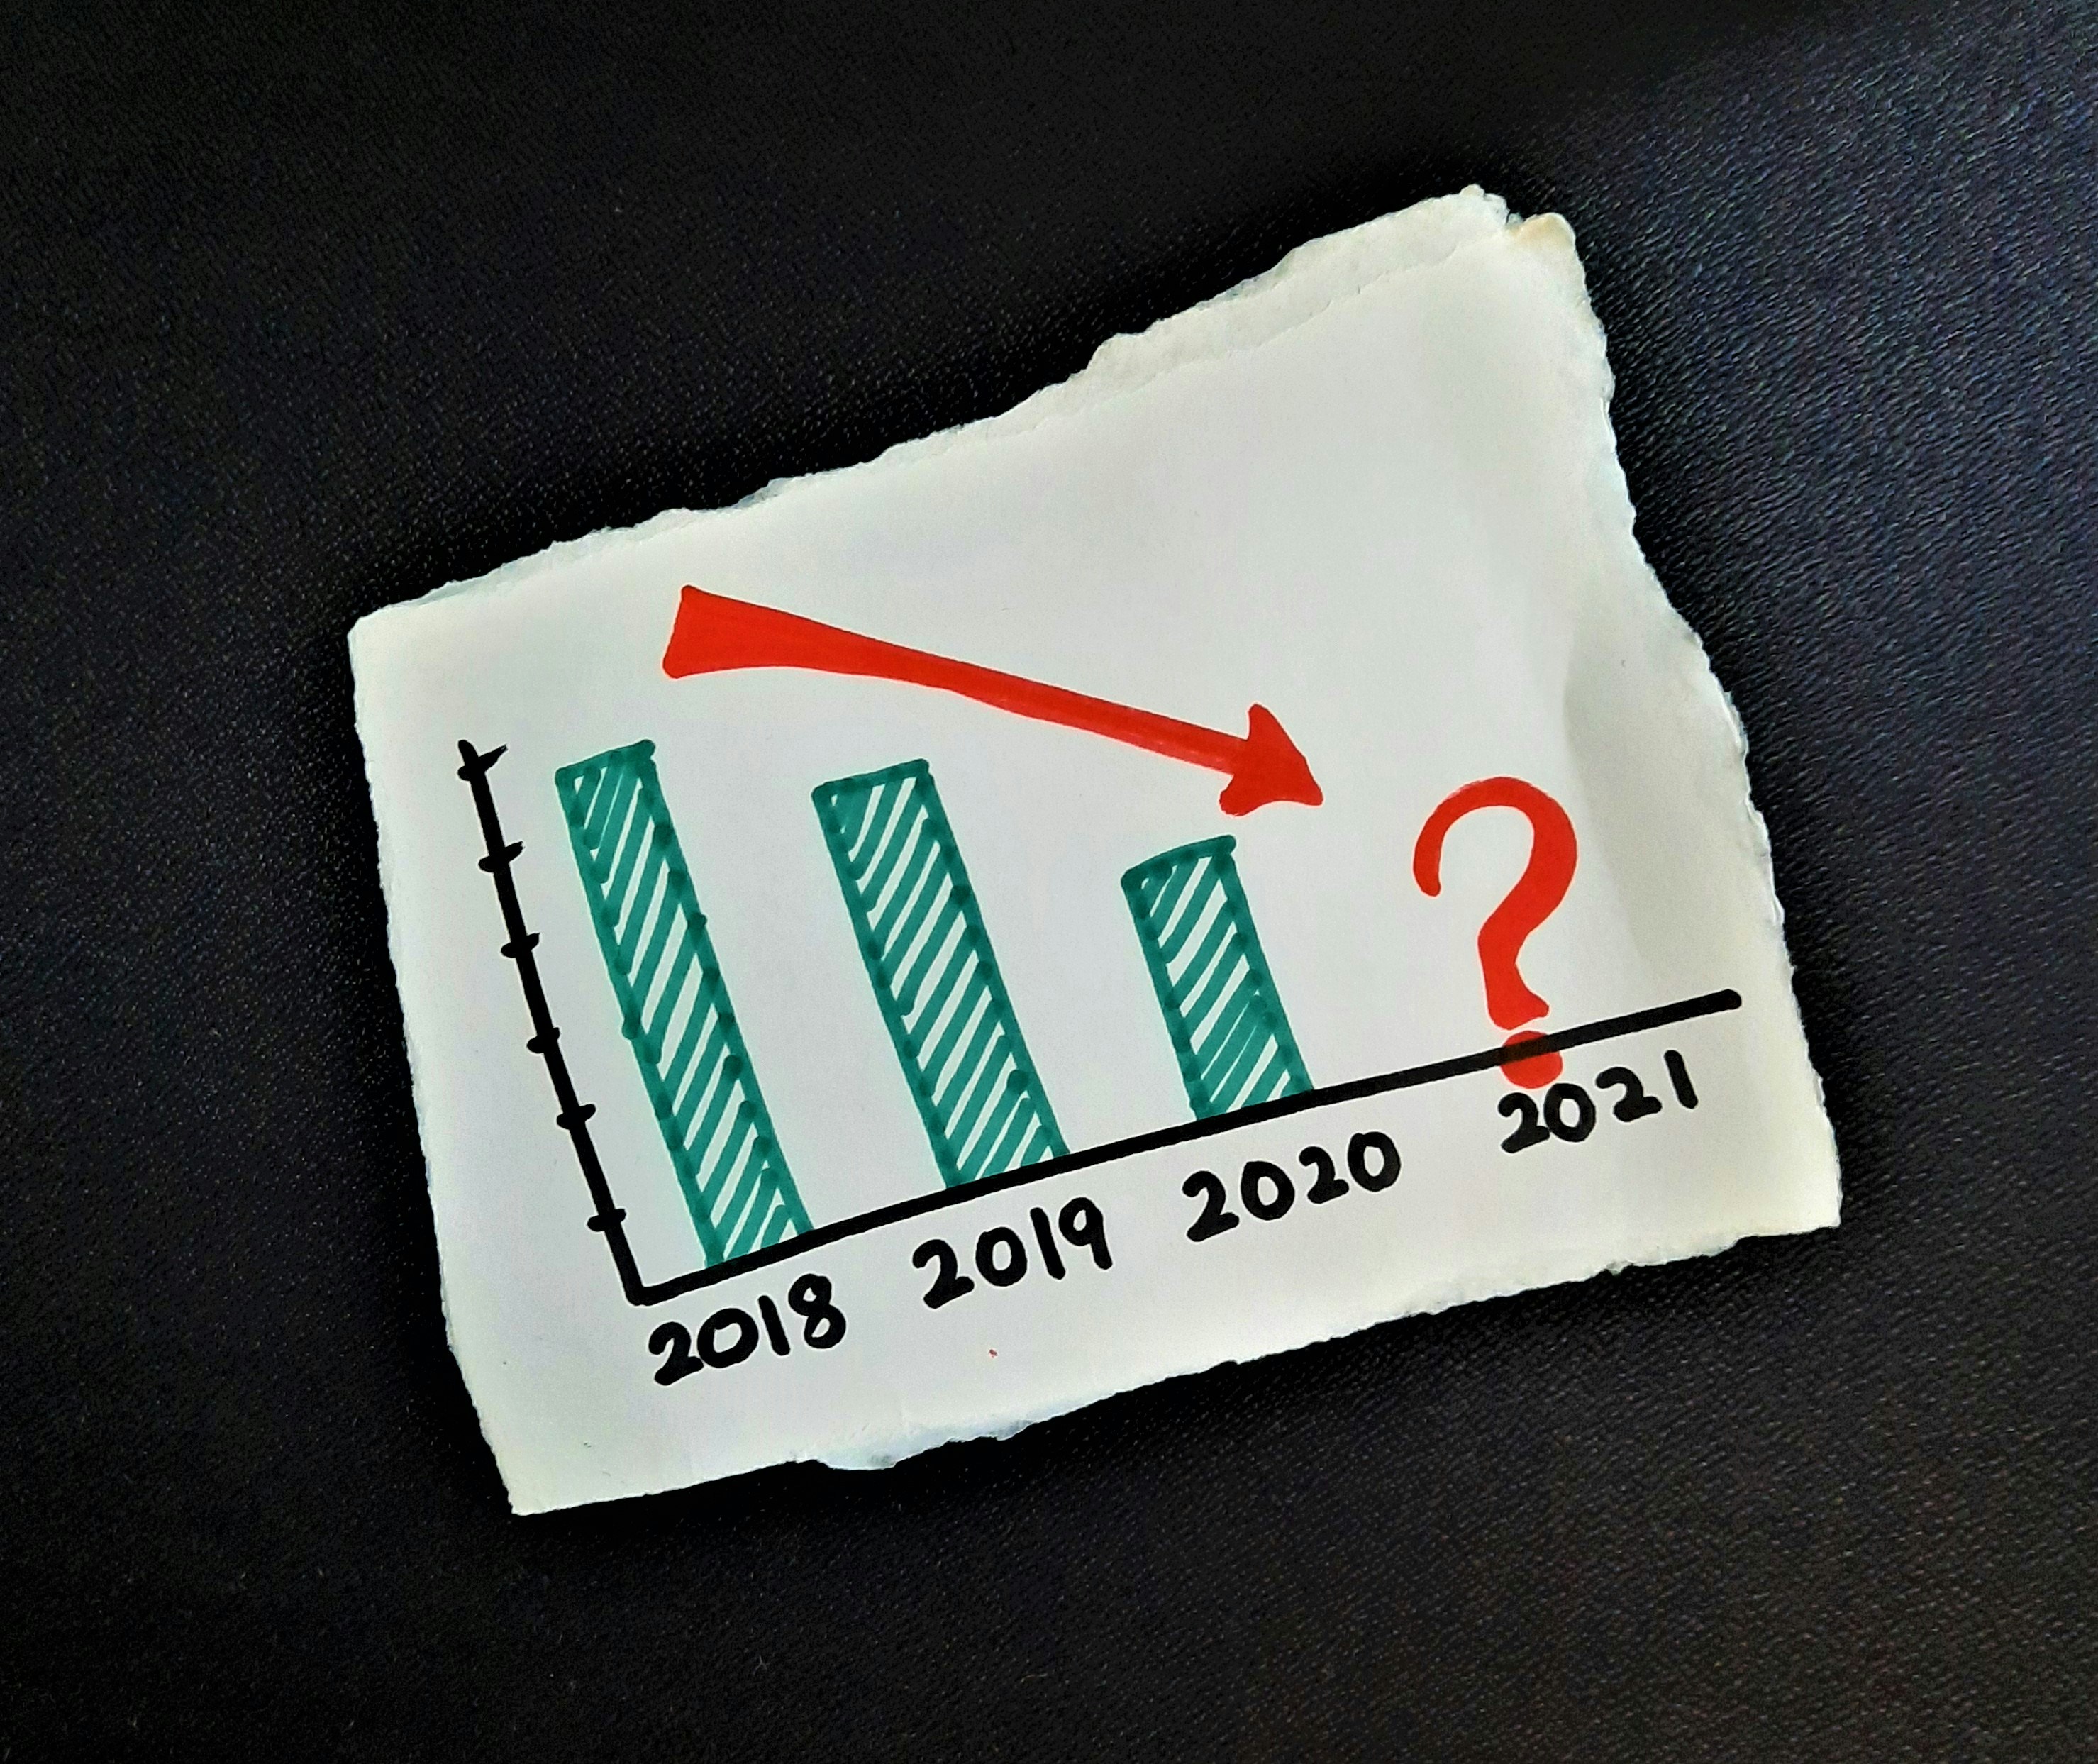
Comparing discrete categories or groups
Read values from the y-axis, compare bar heights
Population by region, rainfall by month, employment by sector
- Check axis labels and units
- Identify highest/lowest values
- Look for patterns or trends
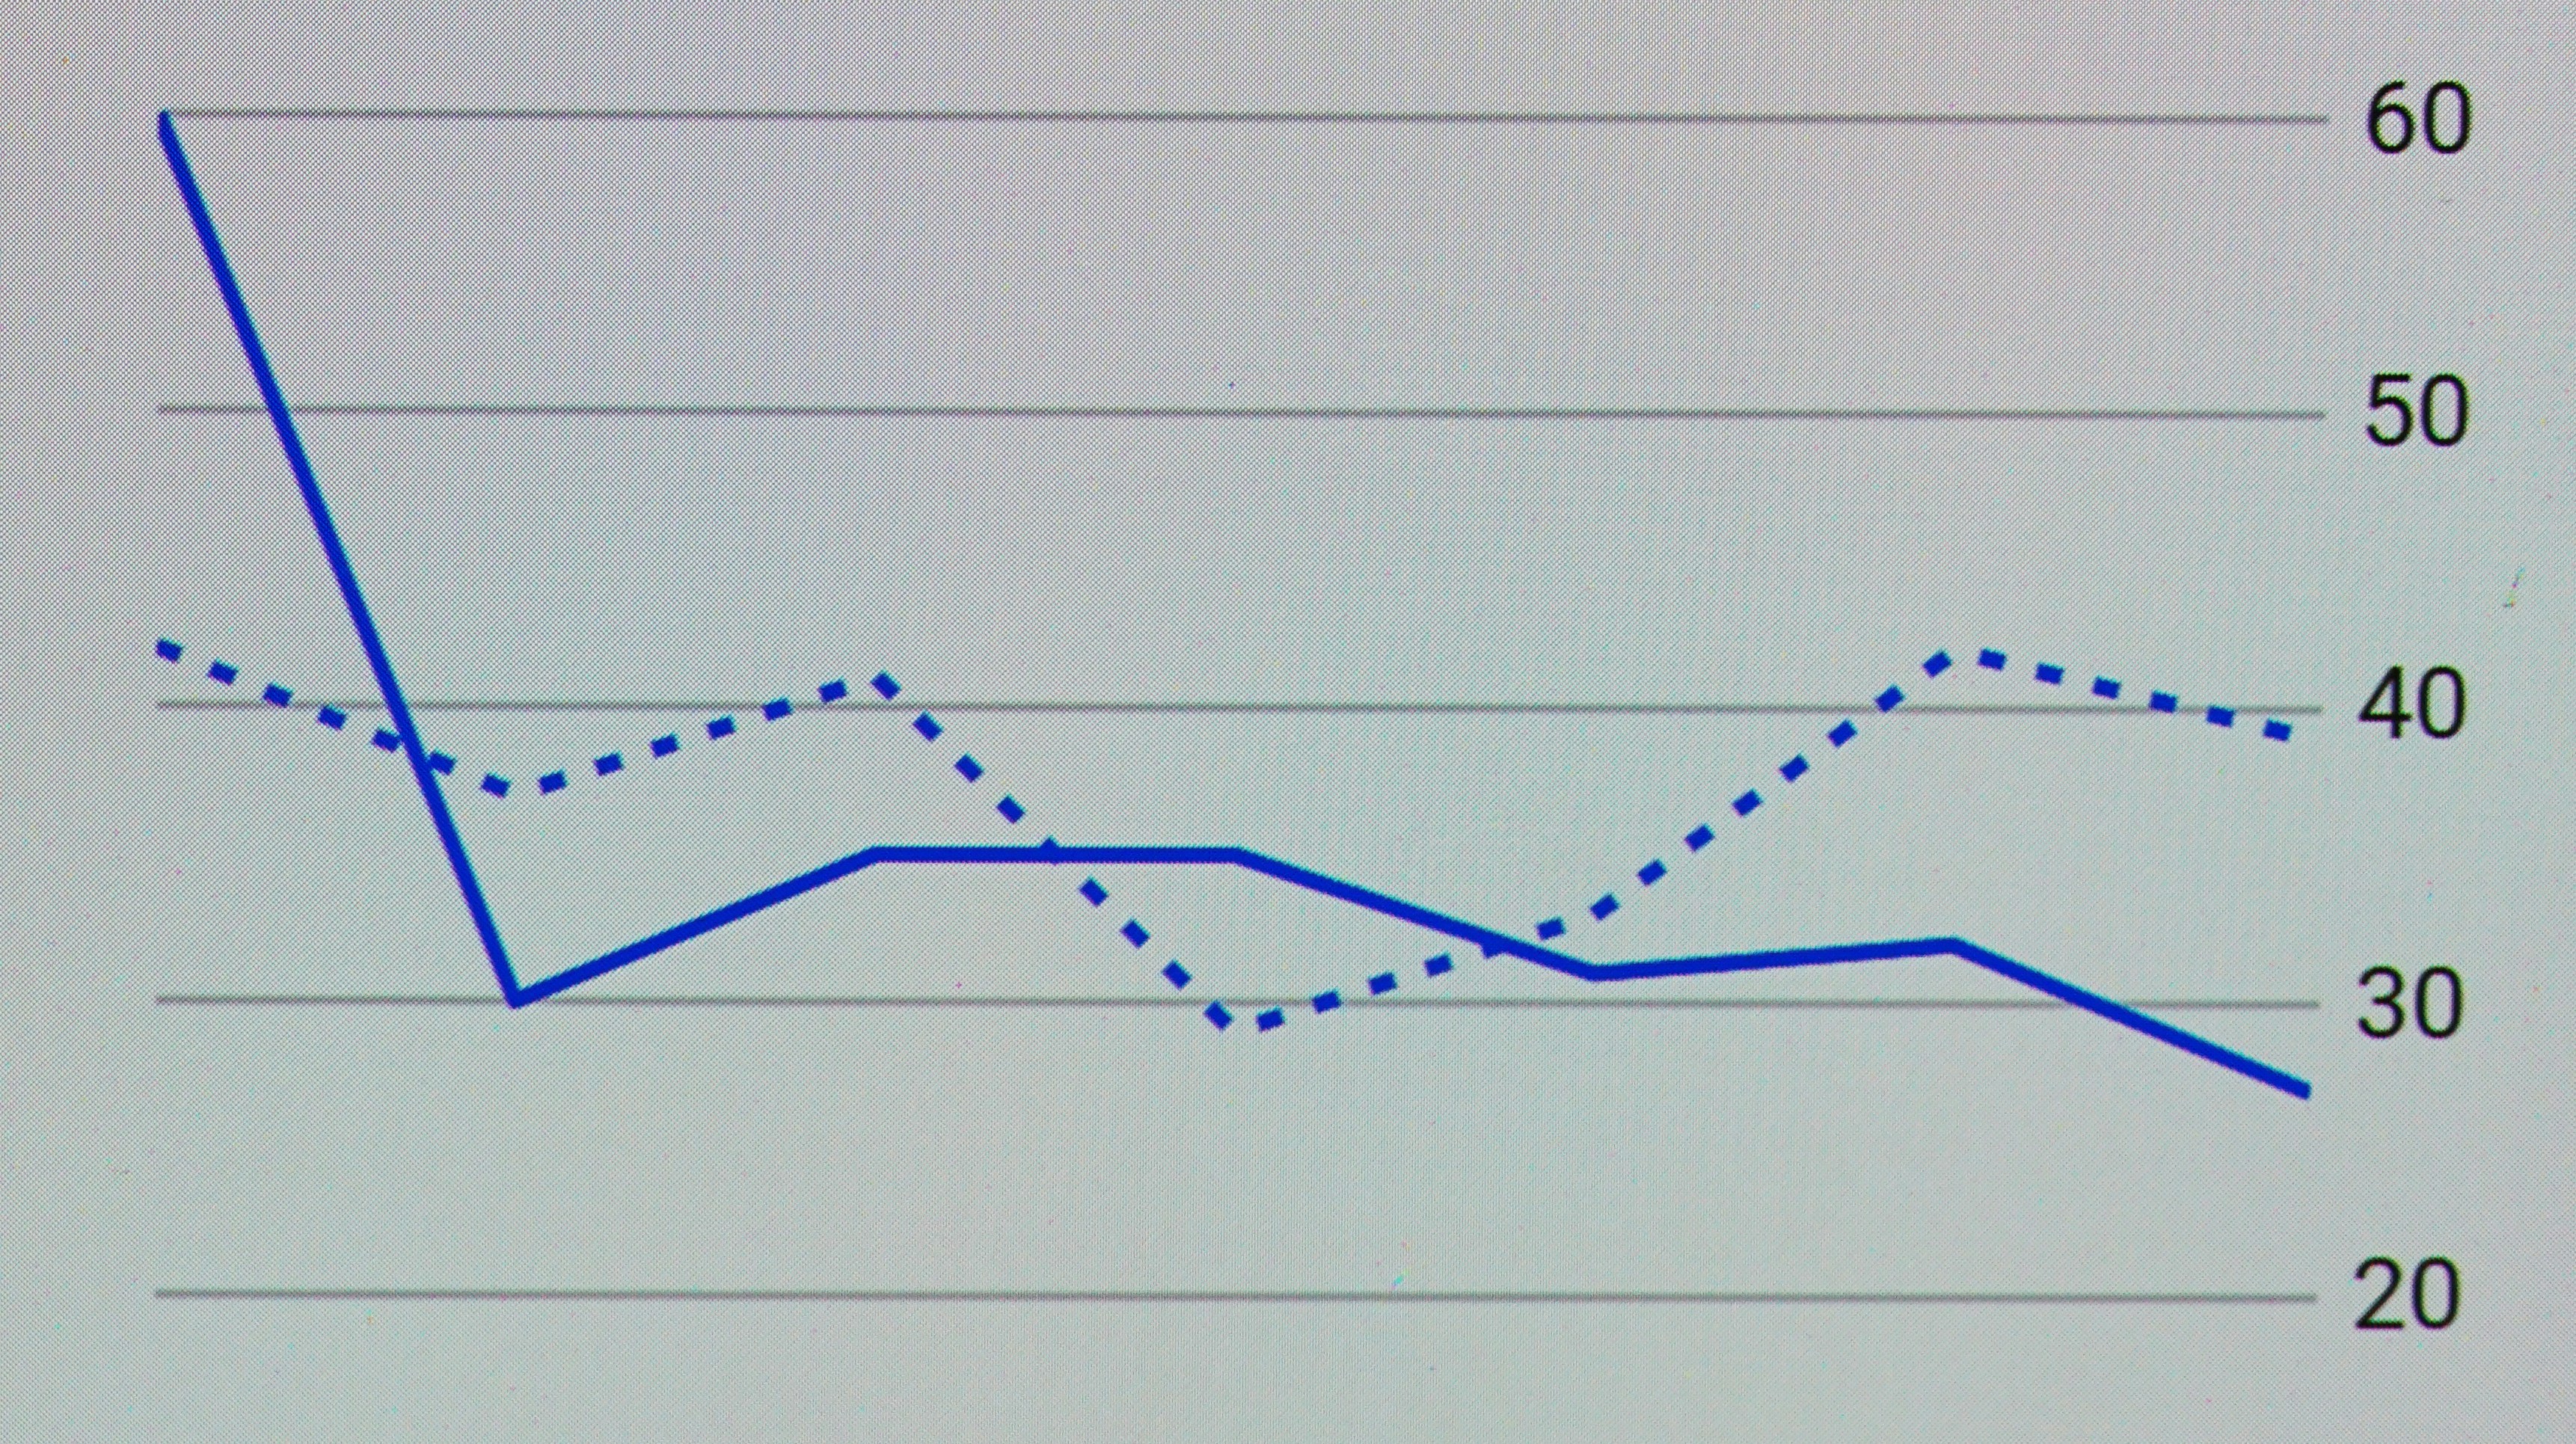
Line Graphs
Showing trends and changes over time
Follow the line to see increases/decreases, identify peaks and troughs
Temperature over time, population growth, economic trends
- Describe overall trend (increasing/decreasing)
- Note any fluctuations
- Identify turning points
Pie Charts
Showing proportions and percentages of a whole
Compare slice sizes, calculate percentages if needed
Land use distribution, employment sectors, energy sources
- Largest slice = highest proportion
- Add percentages to check they total 100%
- Compare relative sizes
Scatter Graphs
Showing relationships and correlation between two variables
Look for patterns, positive/negative correlation, outliers
GDP vs life expectancy, rainfall vs crop yield, temperature vs altitude
- Positive correlation = upward trend
- Negative correlation = downward trend
- No correlation = scattered points
Climate Graphs
Showing temperature and rainfall patterns together
Read temperature from line (left axis), rainfall from bars (right axis)
Monthly climate data, comparing different locations, climate zones
- Two y-axes - check which is which
- Identify wettest/driest months
- Note temperature range
Histograms

Showing frequency distribution of continuous data
Bar height shows frequency, no gaps between bars
Age distribution, income ranges, test scores
- Bars touch (continuous data)
- Height = frequency
- Look for modal class (tallest bar)
Real UK Data Examples
Explore authentic UK geographical data through interactive graphs and detailed analysis.
UK Population Distribution
Population distribution across UK regions showing regional variations.
Southeast England has highest population (9M), Scotland has lowest density
Urban areas growing, rural areas declining, migration to cities
Understanding population pressure, resource allocation, regional planning
UK Temperature and Rainfall
Monthly temperature and rainfall patterns for London showing temperate maritime climate.
Mild winters (4-7°C), cool summers (15-20°C), rainfall year-round
Increasing temperatures, changing rainfall patterns, more extreme weather
Climate change impacts, agriculture planning, flood risk assessment

UK Employment by Sector
Distribution of UK workforce across primary, secondary, and tertiary sectors.
80% tertiary (services), 18% secondary (manufacturing), 2% primary (agriculture)
Deindustrialization, service sector growth, decline in manufacturing
Economic development, job market, skills training, regional inequality

UK House Prices Over Time
Average UK house prices from 1990 to 2024 showing long-term trends.
Steady increase from £60k (1990) to £290k (2024), regional variations
Rapid growth in Southeast, slower in North, affordability crisis
Housing crisis, regional inequality, migration patterns, quality of life

UK Urban vs Rural Population
Comparison of urban and rural population distribution across UK regions.
83% urban, 17% rural, highest urbanization in England
Increasing urbanization, rural depopulation, counterurbanization in some areas
Urban planning, rural services, transport infrastructure, sustainability
8 Question Types to Master
Practice all aspects of data analysis and graph interpretation with our comprehensive question bank.
Read Bar Charts
Extract data from bar charts, compare values, and identify highest/lowest values.
Which region has the highest population density according to the bar chart?
Read Line Graphs
Interpret trends over time, identify peaks and troughs, and describe patterns.
Describe the trend in UK temperature from 1990 to 2020.
Read Pie Charts
Calculate percentages, compare proportions, and understand part-to-whole relationships.
What percentage of UK employment is in the service sector?
Analyze Climate Graphs
Read dual-axis graphs showing temperature and rainfall patterns.
Identify the wettest month and describe the temperature range.

Create Graphs from Data
Construct accurate graphs from data tables with correct scales and labels.
Create a bar chart showing UK population by region using the data provided.
Calculate Statistics
Calculate mean, median, mode, range, and percentages from data sets.
Calculate the mean rainfall for the UK in 2023.
Analyze Scatter Graphs
Identify correlation, draw lines of best fit, and interpret relationships.
Describe the relationship between GDP and life expectancy.
UK Data Analysis
Apply data skills to real UK geographical data and case studies.
Analyze UK population growth trends and explain the patterns.
Everything You Need to Excel
Comprehensive tools and resources designed to help you master data analysis and ace your exams.
Interactive Tools
- Graph Creator - Build charts from data
- Data Analyzer - Extract insights
- Statistical Calculator - Mean, median, mode
- Correlation Analyzer - Identify relationships
- Climate Graph Analyzer - Dual-axis reading
Learning Resources
- Comprehensive Graph Guides
- Step-by-Step Tutorials
- Downloadable Worksheets
- Real UK Data Examples
- Statistical Formula Sheets
Progress Tracking
- Track Your Scores
- Visualize Improvement
- Identify Weak Areas
- Personalized Recommendations
- Achievement Badges
Exam Preparation
- Exam-Style Questions
- Mark Schemes & Model Answers
- Common Mistakes Guide
- Time Management Tips
- Command Word Practice
Choose Your Difficulty Level
Select the level that matches your current study stage. Questions and content adapt to your chosen difficulty.
KS2
Introduction to basic graphs and simple data
Simple bar charts, basic pie charts, reading values, simple comparisons
5-10 minutes per session
KS3
Developing graph analysis and statistical skills
Line graphs, climate graphs, mean/median/mode, trend identification, larger datasets
10-15 minutes per session
GCSE
Advanced analysis and exam-level problem solving
Scatter graphs, correlation, complex statistics, real exam questions, critical analysis
15-20 minutes per session
Ready to Get Started?
Choose how you want to begin your data analysis journey. All paths lead to exam success!
Not sure where to start?
We recommend beginning with the Graph Types section to understand each chart type, then practicing with the Interactive Quiz to test your skills.
Explore Related Geography Tools
Expand your geography skills with our other interactive learning tools and resources.


Frequently Asked Questions
Find answers to common questions about BritGeoHub, our features, pricing, and how we support geography education.
Still have questions?
Can't find the answer you're looking for? Our support team is here to help you get the most out of BritGeoHub.
Key Terms Glossary
Master the geographical vocabulary needed for your exams.
Adaptation
A physical or behavioral characteristic that helps an organism survive in its environment.
Biome
A large naturally occurring community of flora and fauna occupying a major habitat, e.g., forest or tundra.
Climate
The long-term average of weather conditions in a specific region, typically measured over 30 years.
Climate Zone
A large area of Earth with a particular pattern of weather.
Deciduous
Trees or shrubs that shed their leaves annually, usually in autumn.
Ecosystem
A biological community of interacting organisms and their physical environment.
Evergreen
A plant that retains green leaves throughout the year.
Food Chain
A hierarchical series of organisms each dependent on the next as a source of food.
Food Web
A system of interlocking and interdependent food chains.
Permafrost
A thick subsurface layer of soil that remains frozen throughout the year, occurring chiefly in polar regions.
Precipitation
Any form of water - liquid or solid - falling from the sky (rain, snow, sleet, hail).
Temperate
A region or climate characterized by mild temperatures.
Tropical
Relating to the region between the Tropic of Cancer and the Tropic of Capricorn, characterized by hot weather.
Weather
The state of the atmosphere at a place and time as regards heat, dryness, sunshine, wind, rain, etc.